Logging, Firewall, and Monitoring
A couple of Daemons
Before moving forward, let's talk about and add a couple of services to our server.
The first one is fail2ban
fail2ban is a daemon that monitors and bans clients that repeatedly fail authentication checks such as brute forcing SSH.
It is a good idea to run this on any publicly accessible server.
sudo apt install -y fail2ban
The other generic service I'd like to install is chrony
chrony is an implementation of the Network Time Protocol. Cardano is very dependent on time and requires that block producing nodes, relays, and any other node keep accurate time. This is especially critical for block producing nodes as the network expects blocks to be minted and propogated within a second (slot). With default settings chrony will regularly check in with publicly available ntp servers. In our case it will check with pool.ntp.org. While we have the ability to configure many options in /etc/chrony.conf, such as specifying a lower stratum NTP server, the default settings should be more than adequate for our purposes.
sudo apt install -y chrony
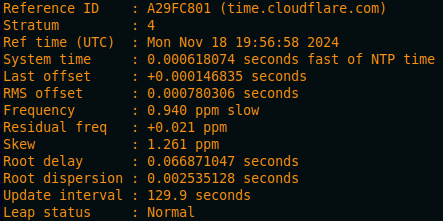
Once installed, check to ensure chrony is keeping your server in sync.
chronyc tracking
Firewall
Running any internet-accessible infrastructure requires some security measures to be taken, and the firewall is one of the most important. Today, we will be using ufw (uncomplicated firewall) which comes packaged with our Ubuntu server Linux distribution. ufw is just a simple and user friendly frontend for iptables, which allows us to configure IP packet filtering rules of the Linux kernel firewall.
First, let's set a couple of default rules.
The first default is to deny incoming traffic.
sudo ufw default deny incoming
Next default is to allow outgoing.
sudo ufw default allow outgoing
Make sure to allow the ssh service to be reached on your server.
sudo ufw allow ssh
In production, it is a best practice to change the port your SSH server uses to something higher and not often used (default is port 22), as there are many scanners out there looking specifically for port 22, and many scanners start scanning at a lower number. We are not going to do this today for a couple of reasons: time, these are not publicly accessible, and these servers are not critical infrastructure.
If you skip this step and enable the firewall, you will no longer be able to access your server!
Let's make our cardano-node port available.
sudo ufw allow 1694/tcp
The cardano-node node-to-node (NtN) protocol was designed to facilitate two-way communication over a single outgoing TCP/IP connection. This means that we can connect with many other nodes even if we did not allow incoming connections on our specified port.
Next we need to open the port for the Prometheus node exporter (more on that in a minute...)
sudo ufw allow 9100/tcp
Then let's open the port to our cardano-node Prometheus exporter.
sudo ufw allow 12798/tcp
Finally, let's enable the firewall.
sudo ufw enable
Then reload it.
sudo ufw reload
If everything was done correctly your SSH session should still be active.
Let's get an overview of our rules real quick.
sudo ufw status

Logging and Monitoring
The next thing we need to do is to turn on some logging and monitoring for our node.
cardano-node comes with the ability to produce Prometheus metrics by default.
Prometheus is an open-source monitoring system
To allow a Prometheus server to scrape data from our node, we need to make an adjustment to our node configuration file.
nano /home/n(x)/preview/config/config.json
Find the "hasPrometheus" line and change the IP from the localhost 127.0.0.1 to listening 0.0.0.0
  "hasPrometheus": [
    "0.0.0.0",
    12798
  ],
We're not quite ready to save and exit the file yet, while we're in here editing, let's make a couple of adjustments to enable logging.
The first we're going to change is the defaultl logging location. This will specify where logs are written if no setup scribe is configured.
Find "defaultScribes" and we are going to change it from Stdout to FileSK, with a path to the logs directory we created earlier.
  "defaultScribes": [
    [
      "FileSK",
      "/home/n(x)/preview/logs/cardano.json"
    ]
  ],
Now we are going to specify the "setupScribes" output. Find the "setupScribes" line and modify it to match the following.
    "setupScribes": [
    {
      "scFormat": "ScJson",
      "scKind": "FileSK",
      "scName": "/home/n(x)/preview/logs/cardano.json",
      "scRotation": null
    }
  ]
Be careful to preserve the .json formatting when adjusting these. It is easy to break the configuration file and prevent your node from starting by accidentally deleting a comma or causing some other syntax error.
Once your config.json file has been updated, go ahead and save ctrl + o and exit ctrl + x
To make these changes active, we need to restart the node.
sudo systemctl restart node.service
Give it a few seconds and then check to make sure the service is running.
sudo systemctl status node.service
You can also query the tip again.
cardano-cli query tip --testnet-magic 2
If you are getting a "socket not found" error when doing this, but your node.service is active, give the node a minute to startup until the socket file is created and try again.
Let's take a live look at our logs with the tail command
cd /home/n(x)/preview/logs/
tail -f n !! cardano.json
You should see the live log output of your cardano-node to the cardano.json file being written to.
ctrl + c to end the command
Next, let's install the Prometheus node exporter.
sudo apt install -y prometheus-node-exporter
This automatically starts the service and the Prometheus server I have configured should be able to scrape your server as an endpoint. You should be able to see your node stats appear on the Grafana dashboard now.